Introducing Qualliscan

I built Qualliscan because I wanted to shorten the chart review process.
Screening didn’t take that long. The slow part was everything after the initial list — checking consolidation quality, relative strength, market conditions, then going through the results one by one to figure out which setups were actually worth putting on a watchlist.
So I started building a tool to do the filtering for me. It was just for my own use at first — a way to cut down the list of potential setups so I could focus on the ones that actually looked interesting.
I started posting my watchlists on Qullamaggies Discord, and I’m grateful I did. Being part of that community made the scanner better. I could cross-reference my setups with what other traders were finding, see what I was missing, and keep refining the methodology. The feedback from that group pushed me to improve the scoring and tighten what qualified as a quality setup.
Qualliscan grew out of that process.
The daily grind
If you trade breakouts using Qullamaggies methodology, you know what the nightly routine looks like. You’re looking for stocks that have already made a move, pulled back into a tight consolidation, and are sitting near a breakout level with volume drying up. You want the ones with strong relative strength in strong groups during a healthy market environment.
Finding those stocks manually means juggling a lot of different inputs. You need a screener to find candidates, then you’re checking consolidation depth, base duration, volume patterns, how tight the structure is, where the trigger sits relative to price. Then you need to know what the broader market looks like — are we in a distribution environment? Have leaders broken down? Is breadth expanding or contracting?
Most traders piece this together across multiple tools. A screener for the initial list, spreadsheets for RS tracking, Stockbee or IBD for market conditions. It works, but it’s slow, and every evening you’re rebuilding the same picture from scratch.
Why generic screeners fall short
Finviz, TradingView, even Deepvue — they’re built to filter on metrics. Price above a moving average, volume above a threshold, market cap in a range. You get a list of stocks that pass the filter. That’s useful, but it’s the starting point.
What they can’t do is evaluate the quality of a consolidation. Two stocks can both be within 5% of their 52-week high, but one has a tight, orderly base with declining volume and the other is a choppy mess. A basic screener treats them the same. You have to open every chart and figure it out yourself.
Same problem with episodic pivots. Hundreds of stocks gap on earnings every season. Which ones represent a genuine re-rating versus a one-day pop that fades? You’d have to pull up each one, read the report, check the numbers, and score it manually.
How Qualliscan approaches it
Qualliscan does four things:
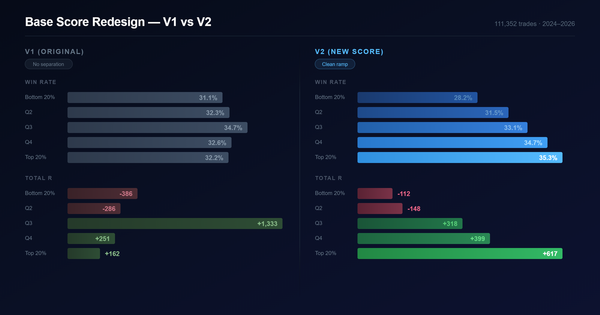
The Breakout Scanner finds stocks in consolidation patterns and scores them. Every setup gets two scores. The Base Score evaluates the consolidation itself — depth, tightness, volume contraction, base duration. The Quality Score looks at the stock behind the setup — relative strength across multiple timeframes, earnings quality, institutional sponsorship. A tight base on a low-quality name isn’t the same as a tight base on a leader, and the scoring reflects that. Instead of opening 200 charts, you get a ranked list of the best consolidations and go straight to reviewing them.
The Episodic Pivot Scanner uses Stockbee’s EP principles to find earnings-driven gaps worth watching. It focuses on earnings surprises and guidance, and filters out the noise. There’s also a Gappers scan for news-driven moves — it captures the news behind each gap and uses AI to evaluate it, pulling out the facts that actually matter instead of making you read through every headline yourself. During earnings season especially, this saves hours.
Relative Strength Rankings break RS down by sector, industry, and theme — 197+ industry groups, each ranked by a momentum composite. You can see rotation happening on Relative Rotation Graphs and find the specific pockets of strength, not just “energy is leading.” The RS Scatter tool lets you plot individual stocks against peers on adjustable timeframes.
The Market Monitor is still a work in progress. It tracks distribution day counts, leader health, breadth, and group rotation in one place. The goal is a systematic exposure model, but it’s not fully there yet — I’m still refining what inputs matter most and how to weight them.
None of this replaces looking at charts. It replaces the hour of filtering and data gathering you do before you look at charts.
Who it’s for
Qualliscan is built for traders running momentum breakout strategies — Qullamaggies approach, CANSLIM, Minervini’s SEPA framework. If you’re spending a lot of time on scanning and want to get to chart review faster, it’s worth trying.
It’s not strictly a charting platform, though it does use TradingView’s advanced charts. It’s primarily built around scanning and scoring — the charting is there so you can review setups without leaving the app. It’s designed for swing traders running breakout strategies, though some of the tools — especially the RS rankings and market data — might be useful to other styles too.
Pricing
The premium tier launches April 14th at $20/month with a two-week free trial. I didn’t want cost to be the reason someone with a smaller account couldn’t use good tools.
If it saves you time on your nightly process, it’s worth it. If it doesn’t, you’ll know before you pay anything.